Ever wonder how major financial institutions seem to influence price movements so precisely? You’re not alone.
Many day traders wrestle with this question, and the answer often boils down to one key concept: institutional order flow. This ultimate guide walks you through everything you need to know about analysing and using institutional order flow in your trading.
We’ll keep it conversational and clear so you can start applying these insights right away.
Institutional Order Flow
Institutional order flow refers to the sizable buying and selling activity by large market players such as hedge funds, pension funds, and investment banks. These organisations conduct trades on a scale that can noticeably shift prices and alter market sentiment. By monitoring these trades, you get a chance to glean insights into where the big players are positioning themselves.
Why does this matter? In simple terms, when institutions lean one way, they can spark a trend or a reversal. Being aware of that tilt can help you ride the wave rather than get crushed by it. Rather than focusing solely on technical indicators, paying attention to significant trades can give you a deeper understanding of potential market direction.
Key Benefits for You
Building that awareness isn’t just for large-scale traders. Even as a day trader who targets modest price swings, you can still benefit by timing your trades around these sizeable moves.
See How it Impacts Traders
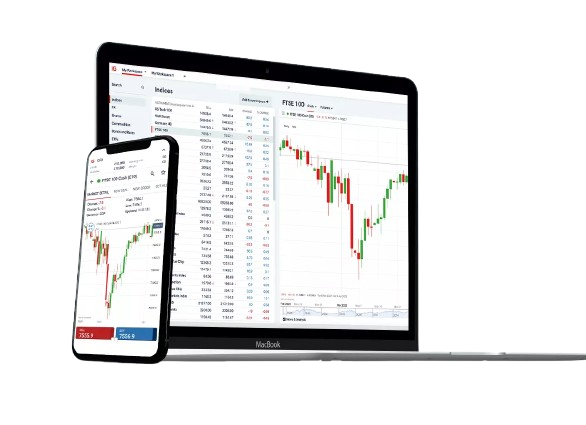
Institutional order flow is about more than just who’s buying or selling. It also has a ripple effect on liquidity, risk premiums, and overall market stability. When major participants pour money into a particular asset, liquidity tends to rise.
That can mean tighter spreads, lower volatility, and fewer wild price jumps. As a day trader, you likely prefer smooth conditions with consistent volume so that you can execute trades without dealing with massive slippage.
On the flip side, if a large institution dumps an asset, it can cause sudden price drops and set off a chain reaction as other traders scramble to exit. While that might be scary for some participants, it can create potential opportunities if you’re ready to spot and potentially ride downward momentum.
The Role of Liquidity
Research shows that high liquidity helps keep risk premiums in check and fosters confidence among market participants. Market-makers and speculators facilitate liquidity when they stand ready to take the other side of a trade. If you’re a day trader looking for swift ins and outs, you want to trade liquid assets where the bid-ask spreads are tight.
Liquidity ties in nicely with institutional order flow. Large buyers and sellers thrive in markets where they can move big blocks of shares or contracts without slamming the price. When they do step in, it can create a wave you might be able to ride.
Spot Common Manipulation Tactics
Let’s be honest, while institutional order flow offers plenty of benefits, some players may try to manipulate the market through spoofing, layering, or other underhanded tactics. Staying alert can help you steer clear of traps.
You don’t need to become an expert in these tactics overnight, but do keep them in mind. If something in the order book looks too good to be true, it might be one of these moves at play.
Use Institutional Flow Effectively
How do you put this knowledge into practice? It starts with paying attention to more than just price charts. In recent years, electronic trading platforms have made it easier for retail traders to see aggregated order data (sometimes referred to as Depth of Market or Level II/Level III data). This data can give you clues about where big block orders are sitting.
Practical Steps
A balanced approach means using order flow analysis alongside your usual technical or fundamental process. When these signals reinforce each other, you get extra confirmation to enter or exit the market.
Recognise ICT Order Block
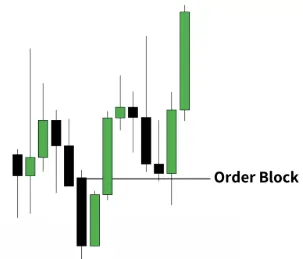
Within order flow analysis, the ICT (Inner Circle Trader) Order Block often gets the spotlight among traders. This concept zeroes in on chart regions where institutions place large clusters of buy or sell orders, driving a new wave of momentum.
When price fails to move against those blocks, it suggests those institutional positions remain strong.
For example, a bullish ICT Order Block can appear when the market dips, breaks structure upward, and then pulls back into the block where big-money buyers might add more positions.
Bullish Order Flow Cues
Bearish Order Flow Cues
Delve into the Research Angle
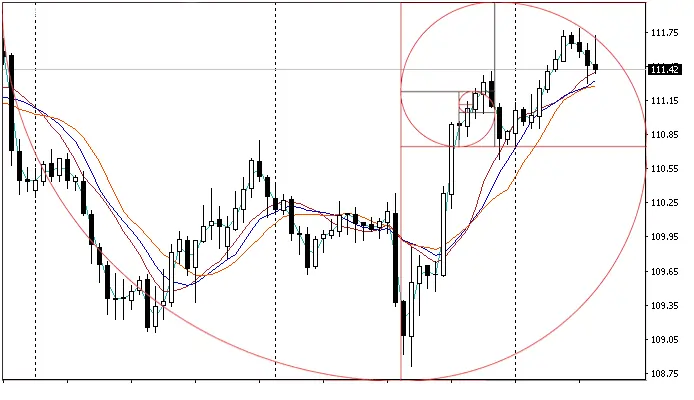
If you like a little academic support for your trading ideas, you might want to check out a paper by John Y Campbell and colleagues titled “Caught on Tape: Predicting Institutional Ownership with Order Flow.”
Their findings highlight that retail buying and selling can help predict future institutional ownership shifts.
In other words, if you spot a wave of retail net buying, institutions often increase their positions in the following quarter. This dynamic reveals how interconnected retail and institutional players can be, even if you feel like you’re trading in completely different leagues.
Why it Matters for You?
Explore Liquidity’s Role

Institutional activity thrives in liquid markets. Liquidity ensures fast and seamless trade execution without significantly slippage.
The link here is simple: if large investors see plenty of liquidity, it encourages them to deploy capital more confidently, which can then ramp up market moves you might want to hop on.
Liquidity Indicators
In the stock market, you’ll often see giant names like Amazon.com Inc. or Ford Motor Co. trading tens of millions of shares in a single day, suggesting healthy liquidity. By contrast, a smaller stock with only a few thousand shares traded daily could be riskier due to price jumps or wide spreads.
Practice Risk Management
All the institutional order flow analysis in the world won’t matter if you’re not managing your risk appropriately. When you notice signs of big buyers stepping in, it’s tempting to go all-in and chase the move. But you still need to set stop orders, position sizes, and exit targets that match your risk tolerance.
It’s normal to feel a burst of excitement when you see institutions piling into a stock or currency pair. Yet remember, even institutions have losing trades. Nothing is guaranteed, so stick to your rules.
Use Options for Hedging
If you want more flexibility, consider tools like options, which allow you to hedge risk or enhance profits. Institutions often deploy options to manage large positions without fully selling an underlying asset.
Options can be complex, so practice these methods on paper or in a demo account first. Remember that institutions may be writing or buying the same options you’re eyeing, which can show you how they’re hedging or speculating.
Look out for Institutional Order Flow in Forex
Foreign exchange (forex) is known for its around-the-clock liquidity, and institutions can move massive amounts of currency in the blink of an eye. Institutional order flow in forex typically involves large banks or even central banks changing currency holdings. Such shifts can create strong pushes in currency pair within a short time.
Forex day traders who can recognize a big bank drive can ride short-term trends that lead to outsized gains, though caution is critical. Quick price spikes can reverse just as fast if news or policy changes come into play.
Follow a Simple Order Flow Checklist
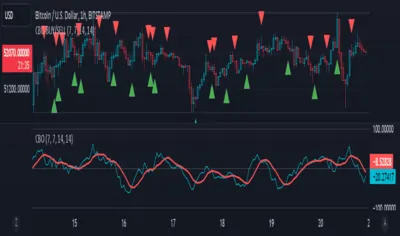
You may be wondering, “How do I turn all this into a straightforward routine?” Below is a handy checklist you can refer to before, during, and after each trading day.
- Scan for top headlines or economic releases that might spark large institutional moves.
- Check pre-market volume on stocks or currency pairs you like to trade.
- Watch Depth of Market or Level II data for spikes in big orders.
- Monitor key support and resistance zones for sudden buying or selling.
- Track any strange patterns, like frequent large orders that get canceled (spoofing).
- Review your trades. Did you enter where the order flow aligned with technicals?
- Note any patterns of large-lot buying or selling that might carry over to tomorrow.
- Adjust watchlists and alerts for the next session.
Running through a process like this helps you stay organized and balanced. It’s easy to get caught up in the moment, so a daily checklist can keep your decision-making consistent.
Common Queries Related to Institutional Order Flow
What is Institutional Order Flow?
Institutional order flow refers to the large-scale buying and selling activity by major financial entities like banks and hedge funds, which can significantly influence market prices and trends.
Why is institutional order flow important for traders?
Understanding institutional order flow helps traders anticipate market moves, manage risk, and align strategies with the dominant market forces, improving trading outcomes.
How do institutions execute large trades without moving the market?
Institutions often break large orders into smaller ones, using sophisticated strategies to mask their intentions and minimize market impact.
Conclude and Move Forward
Now that you have a clearer roadmap for decoding institutional order flow, you can:
While you might not have the firepower of a top hedge fund, you do have agility on your side. As a day trader, you can pivot faster and scale in or out of positions in ways large institutions can’t. By combining this flexibility with a genuine understanding of how institutional order flow shapes the market, you’ll be better equipped to make decisions that suit your trading goals.
Give some of these practices a try as you analyze your next few trades. Keep it simple, stay disciplined, and remember that spotting institutional footprints doesn’t guarantee a win, but it can nudge the odds more in your favor.
If you have any favorite tricks for following big players, share them or compare notes with fellow traders. That collaboration, along with your new knowledge of institutional order flow, can help you develop a solid edge.
Good luck out there.


