Welcome! If you’ve ever wondered why certain price levels in the markets seem to attract so much attention, you’re in the right place. The answer often lies in liquidity zones, where buyers and sellers converge to make big moves.
In this ultimate guide, you’ll discover how to identify liquidity zones in your trading charts, so you can anticipate where the market might turn or trend next. By the end, you’ll feel confident spotting these areas and integrating them into your trading game plan.
Before we jump in, keep in mind that liquidity zones are more than just colored rectangles on a chart. They represent the hopes and fears of major market participants—especially institutional players whose massive orders can truly shift price dynamics.
In the sections that follow, you’ll learn how to spot these zones, why they matter, and how you can use them effectively.
Market Participants
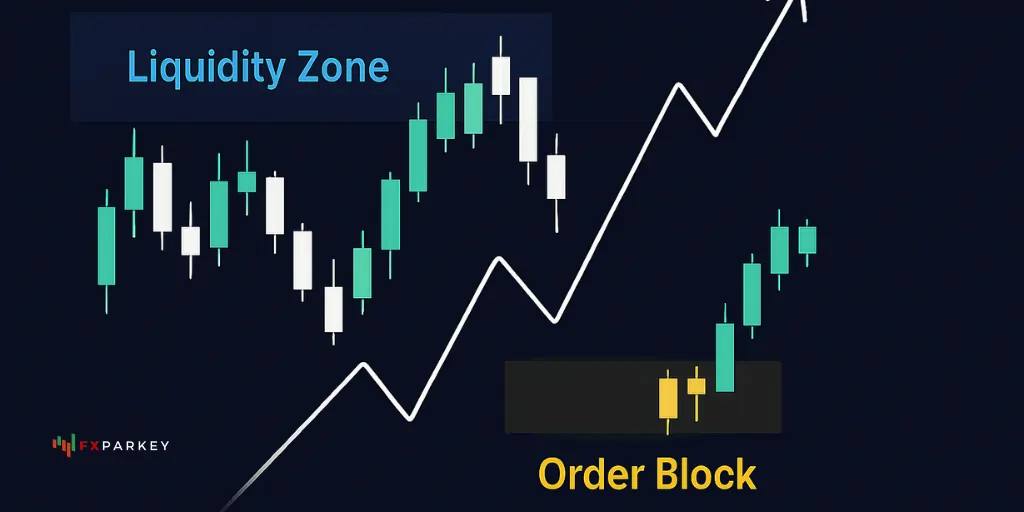
Market prices reflect constant tug-of-war between different trader groups. By learning who they are and how they behave, you’ll make sense of liquidity patterns on your chart.
Institutional vs. Retail Traders
Institutions often leave footprints on the chart, especially around key levels where they place bulk orders. When you see price stalling, consolidating, or snapping back at a specific level, it often means institutions are loading up or unloading big positions.
Why do Liquidity Zones Attract Big Players?
For major traders, getting in and out of huge positions is tricky. They don’t want to cause dramatic price spikes that sabotage their own entries. So, they look for places where they can quietly absorb any available orders—these spots are often dubbed “liquidity zones.” You’ll recognize them by bursts of trading volume or recurring bounces on the price chart.
Understanding how to identify liquidity zones can give you a similar vantage point, so you’re not surprised by sudden reversals or breakouts.
Discover What Liquidity Zones are
A liquidity zone is a price region where buy and sell orders stack up. It’s like a hot spot that tends to attract plenty of market interest. When you’re trading, you want to keep an eye on these pockets because that’s where the action is likely to heat up.
Core Features of Liquidity Zones
In short, a liquidity zone is where a whole lot of participants agree or disagree on price at the same time. Once the market picks a direction out of that zone, it can move fast.
How do institutions manage to hide big orders?
Large traders often use strategies to mask their massive volume. For instance, they might break orders into smaller pieces so that the market doesn’t detect a single large trade.
That can cause an extended consolidation phase in these zones, with intermittent mini-spikes in volume. Once either the buying or selling side starts to dominate, price often rockets away.
Recognize price consolidation areas
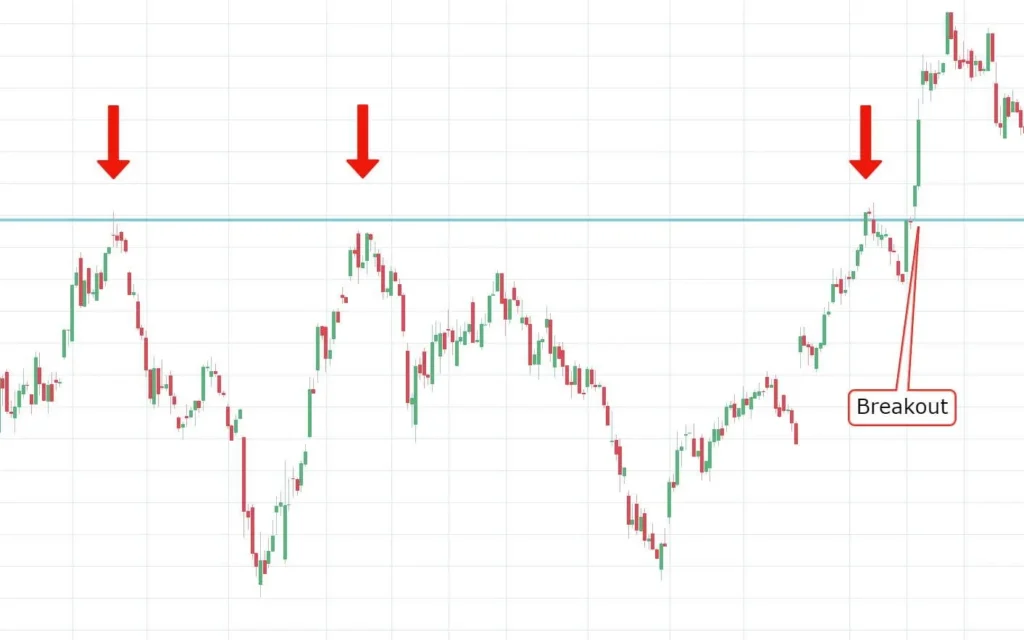
When price seems to go sideways for a bit, it signals a potential balance between buying and selling pressure. This sideways action is sometimes called accumulation or distribution.
You’ll see lots of overlap in the candles, and the price stays within a tight horizontal range. This often reveals a liquidity zone because big players are either loading positions (accumulation) or unloading them (distribution).
How to Spot Consolidation Effectively?
Pinpoint High Volume Regions
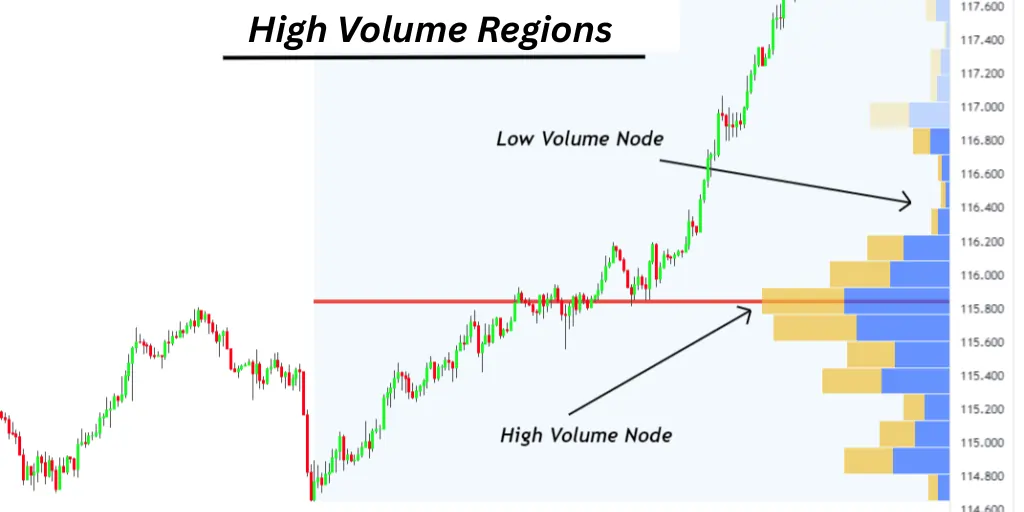
Volume is a huge part of liquidity zone identification. Think of volume like a spotlight: it shows you where the action is happening. When the market trades at high volume, it means lots of participants want in or out.
Using Volume Profiles
A popular tool to figure out exactly where high volume transactions occur is the Volume Profile indicator (available on many trading platforms). It displays the amount of volume at each price level rather than over time.
When you see a mountain peak in the profile, that often indicates a liquidity zone. Price may keep revisiting that level until the major orders are satisfied.
Interpreting Volume Spikes
Say you see an abrupt jump in volume on a candlestick. Suddenly there’s a flood of buy or sell activity. Keep an eye on that price region. If it remains a magnet for trades in the next candles, it might be a fresh zone of liquidity.
Note the highest volume cluster, then see if price retests or bounces. If yes, you’ve probably identified a legitimate hotspot.
Identify Support and Resistance Clustering
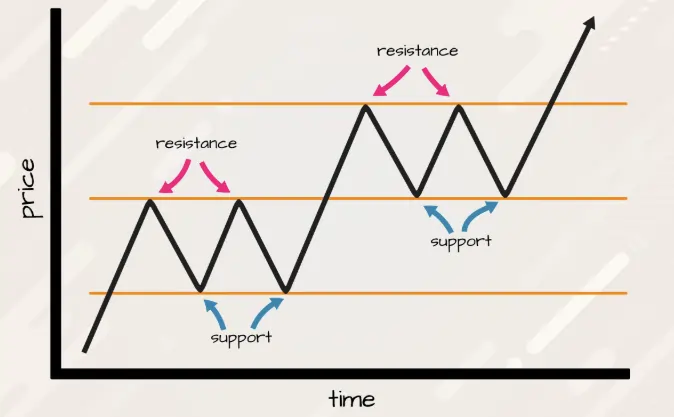
Support and resistance lines are the bread and butter of technical analysis. When you see multiple support or resistance lines converging in the same price region, that’s often where liquidity is stacked.
Why? Because traders who rely on these lines to set stop-loss or entry orders tend to bunch up right around them. That clustering effect fosters big pools of waiting liquidity.
Steps for Analyzing S/R Clusters
Spot Order Block Footprints
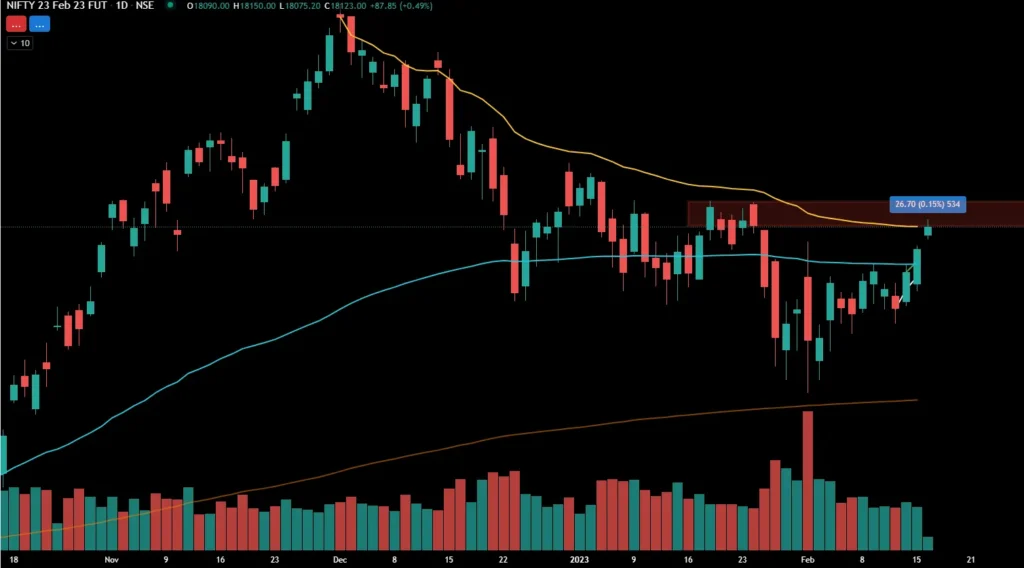
Order blocks are areas on the chart where institutions notoriously place large orders before a big price move happens. These blocks often form near the top or bottom of consolidation zones.
Once the market breaks out, it tends to revisit these areas later, seeking liquidity or leftover orders.
How to Read Order Blocks?
By noting these footprints, you’ll often predict when and where big players may enter or exit, even days or weeks after the initial move.
Use the Right Tools and Indicators

Technicals can help you get a snapshot of where liquidity could accumulate. Here are a few popular indicators and tools you might find helpful for seeing these zones more clearly.
Volume Profile or Volume Heatmap
We touched on the Volume Profile already, but some traders prefer heatmaps that visually show where large orders are sitting in the market. These might require Level II or Level III data, which reveals the order book depth. If you have access, it’s a powerful complement to simple candlestick analysis.
Support and Resistance indicators
Many charting platforms now offer automatically generated S/R lines or zones. If you’re new to charting, these tools can give you a baseline to work from. Just remember to confirm those levels with your own analysis of volume, candle patterns, and market flow.
Moving Averages as Confluence
Moving averages (MA) can also help you confirm a liquidity zone. For instance, if price hovers around the 200-day MA while volume spikes and candles converge, you might have found an area that institutional traders are eyeing. You can even check multiple MAs, like the 50-day or 100-day, to see if there’s overlap, which often boosts the zone’s credibility.
Analyze the Emotional Side

Traders aren’t robots. Emotions run high when price approaches a critical level. That’s another reason liquidity zones attract so much attention.
Once you understand that fear, greed, and hope combine in these zones, you’ll see why price often whipsaws around them before making a decisive push.
Common Emotional Triggers in Liquidity Zones
Amateur traders often place their stops around these same areas, making them even juicier targets for institutional players who aim to fill positions at better prices.
Combine Confluence Factors
The best way to increase the probability of identifying effective liquidity zones is to combine multiple signs:
When two or three signals align, that zone stands a good chance of being highly liquid. Confluence basically means each factor is confirming the others, like witnesses backing each other’s stories.
Example of Combining Confluence
Map Out Your Trading Process
If you’re ready to put this into action, it helps to follow a sequence. Here’s a step-by-step method you can tweak to fit your trading style.
Watch Out for False Signals
Some levels may look like liquidity zones but turn out to be traps. Price might poke into an area, appear to bounce, then plummet in the opposite direction. Here’s how to reduce false signals:
Consider Retail vs. Institutional Clues

Remember, liquidity zones exist because big players need those areas to fill their enormous orders without causing major price dislocations. As a retail trader, you want to align with institutional footprints, not fight them.
Reading the Tape
Tape reading (or order flow analysis) can be illuminating. If you see large transactions consistently going through at a given level, that’s often a clue. Of course, not all platforms offer raw tape data, but if you can access it, you’ll see exactly when large orders pop up.
Spot Whipsaws
One hallmark of big players at work is a sudden, sharp move in one direction, only for price to zoom the other way right after. This is typically a liquidity grab, where institutions push price briefly to trigger stops or call attention to a specific zone, then drive it the other way. If you watch carefully, you can trade those whipsaws by waiting for the final directional outcome.
Adapt to Changing Market Conditions

Market dynamics shift all the time. Liquidity zones that worked well yesterday might fall flat when volatility spikes or major news hits. Always keep an eye on broader conditions like economic calendars or political events.
These can dramatically alter how participants place orders, and consequently, where liquidity pools formed.
Tips for Evolving Markets
Common Mistakes to Avoid
Real-World Example Scenario
Imagine you’re looking at a currency pair chart on the 1-hour timeframe. Price has been sliding downward for days. You notice:
Suddenly, you see a bullish candlestick break out of the consolidation with an uptick in volume. That’s your signal: a possible liquidity zone is at that 1.1500 to 1.1520 mark. If price later retests 1.1510, moving out again with volume, you might have found your entry.
Key Takeaways and Next Steps
Common Queries Regarding Liquidity Zones
What is a liquidity zone in forex trading?
A liquidity zone is a price area with high buy/sell order concentration, often near support/resistance or round numbers.
Why are liquidity zones important for forex traders?
They help identify reversal points, breakouts, and optimal entry/exit levels by showing where big players are active.
How do you identify liquidity zones on a chart?
Look for repeated price bounces, strong reversals, or consolidation at key levels such as support/resistance or round numbers.
What is the difference between a liquidity zone and an order block?
A liquidity zone is an area of high order concentration; an order block is a specific price range where institutional activity occurred.
How do liquidity zones affect price action?
Price may reverse, consolidate, or break out at these zones due to large order execution or stop hunting.
End Note
Identifying liquidity zones isn’t about perfection. It’s about increasing your probabilities of entering or exiting at levels where the market is highly engaged. The more you practice, the more intuitive finding these hotspots will become.
You’ll start to see patterns emerge—like how institutions hide orders or how retail traders all pile on at the same levels. With enough screen time, you’ll feel more confident anticipating those price reactions rather than just reacting after the fact.
If you’re ready to dive deeper, try using a demo or small live account to test out how you identify liquidity zones in real-time charts. Keep a trading journal detailing your findings—where you marked a zone, what signaled your entry, and how price behaved once it got there. Over countless observations, you’ll refine your strategy into something that works for your style and risk tolerance.
Ultimately, staying ahead in trading means knowing where buyers and sellers are most likely to appear. Once you’ve got a handle on these zones, you’ll navigate the markets with a clearer map, anticipating moves rather than chasing them. Happy trading!


